Gain actionable insights from your Google Analytics, Google Ads and Google Search Console data in 6-weeks with our “Data Adoption Plan”
100+ point Google Marketing Suite, Marketing Tag, and general analytics usage AUDIT and 1:1 consultation


Google Analytics and Tag Manager SETUP including over 100 events, goals, filters and other best practice settings.


Performance monitoring, alerts and a Google Data Studio Dashboard to ease DIY REPORTING
If you answer yes to any of these questions, this 6-week introduction plan is for you:
- Are you hesitating to do more online because you don’t trust your data?
- Have you recently gained control of your Google Analytics account and unsure what is going on?
- Confused by all the customization and configuration settings but know you need more actionable data?
- Want to track video performance, form submits, downloaded files, time on page stats and more?
- Want a partner your agency can trust to keep your clients Google Marketing Suite accurate, actionable and easily accessible?
- Get under 100,000 sessions to your site every month? (click here if you need a more customized approach)
Learn more and recieve a marketing tag audit:
The Data Adoption Plan is based upon implementations from 100’s of growing, mid-size, and household brands such as:


How is our Data Adoption Plan different from other Google Analytics implementations?
Go beyond the basics and measure User Engagement, Conversion and Loyalty
Perhaps you are already tracking your purchases or online form submits. But leads to those activities?
Organized into three sets to represent top, middle and bottom level user conversions we setup 15 preconfigured goals to make it quick and easy for you to measure marketing, device or landing page performance. You likely have custom goals you would like to track in Google Analytics as well. Use your block of analyst hours to get hooked up!
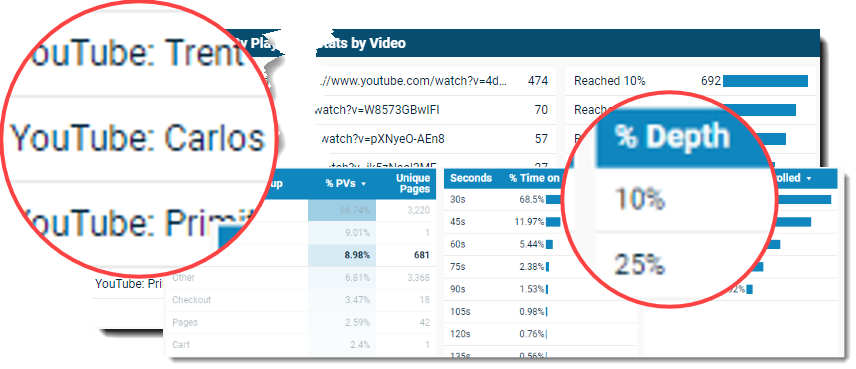
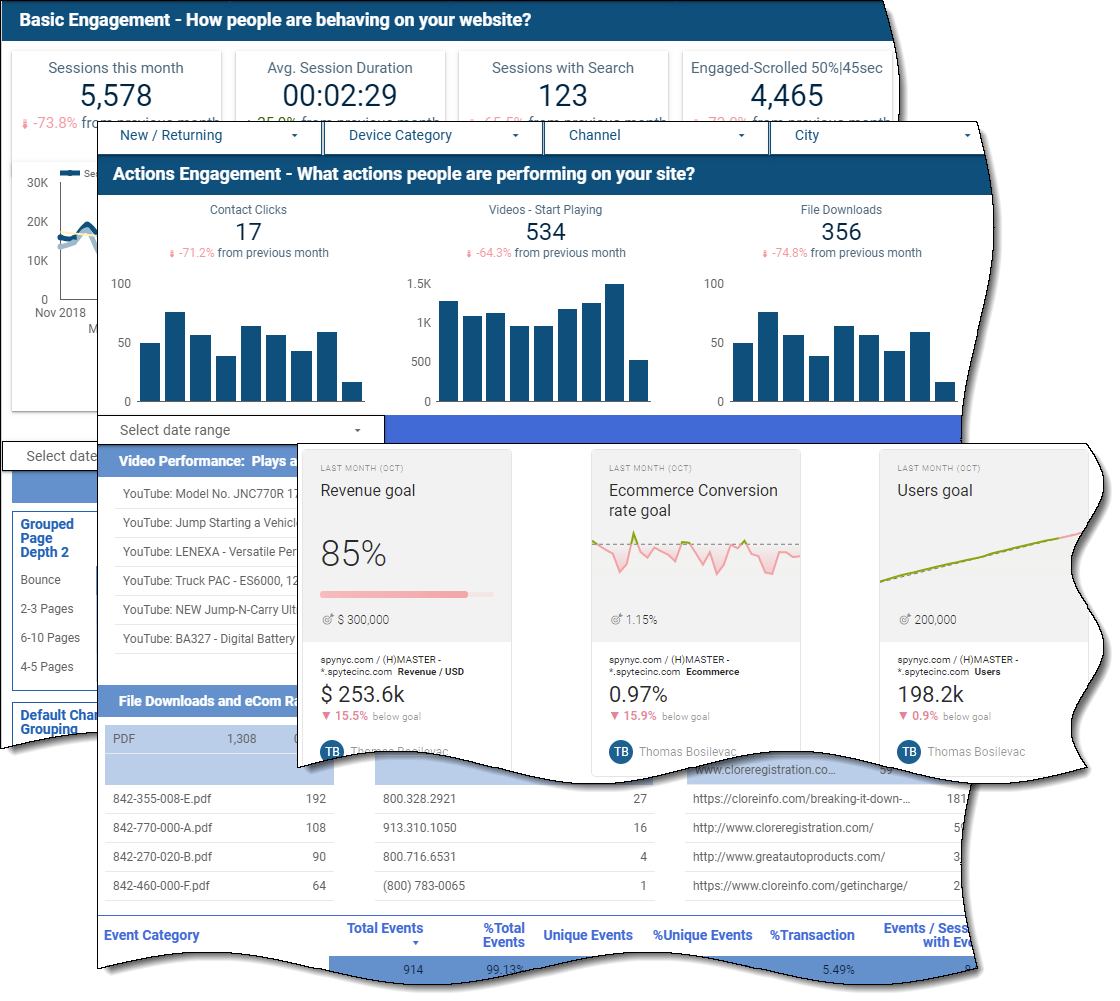
Track beyond page loads and measure the actions your users take
View detailed information about Video Performance, Outbound Partner Clicks, Form Submits, Phone Number Clicks, Scroll Tracking, Dwell time, and much more.
No need for extra development work, our GTM Container is already configured to track all the important things your users do (which Google doesn’t track automatically because they are not technically “pageviews”).
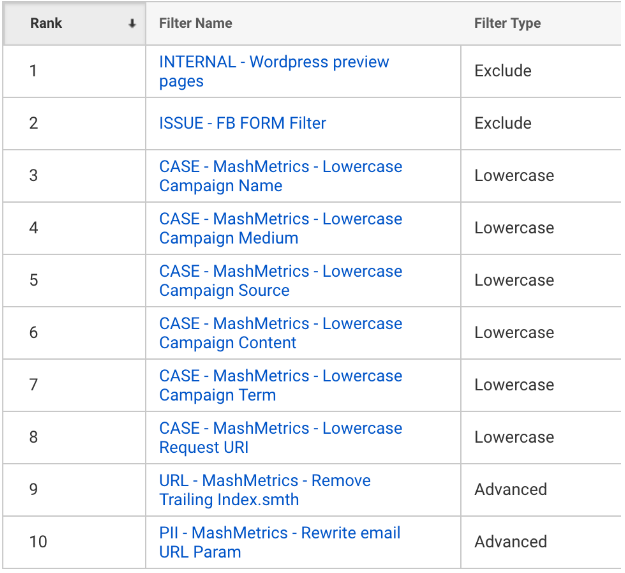
Keep your data accurate with best practice configuration settings and filters
The default Google Analytics settings no longer keep your data as clean as you need when spending money growing traffic. We are constantly on the lookout (our automated monitoring helps!) for issues such as query string parameters duplicating your URLs in the pages report, excluding bots and spiders or excluding PII from being sent to Google Analytics in the first place to comply with GDPR an other legal requirements.
We have over 100 checkpoints in order to make sure your data is as clean as it can be so you can be confident in you next board meeting when presenting your new insights.
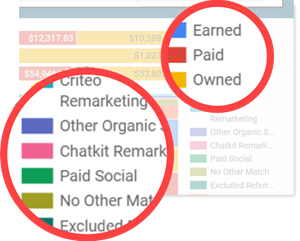
Custom groups of your traffic sources to find patterns more quickly
Sure, Google Analytics already groups your traffic into Organic Search, Paid Search, Social, etc. That is usually not the way you (or your boss) wants it reported. We create more customized groups from a high level (Paid, Earned, Owned) to more specific channels (Chat, Transactional vs Newsletter emails, ReTargetting vs Keyword Campaigns and more).
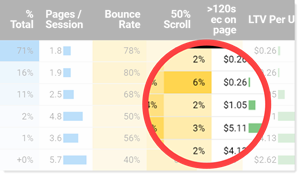
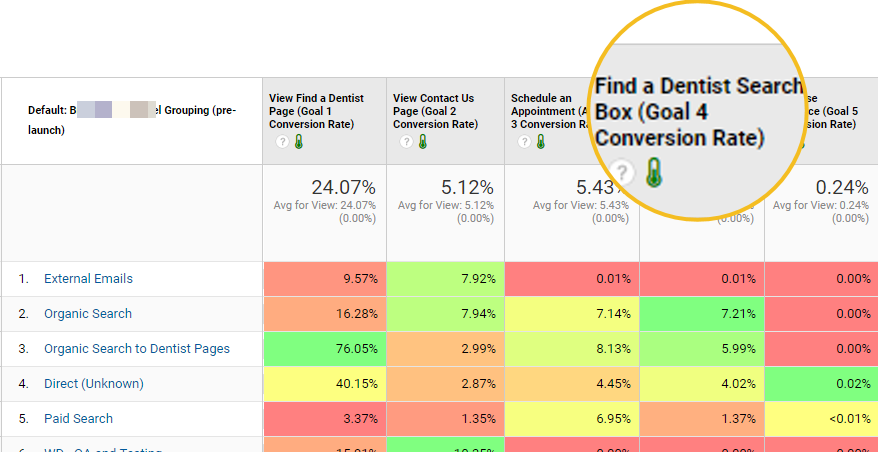
Heatmaps and mini-bar charts to easily find patterns
Google Analytics collects great data, however when it comes to visualizing that data, even they agree Google Data Studio is where it is at. View your data in whole new ways with not just charts and graphs but with enhanced table visualizations as well.
In order to assure your tables and charts do not look like a rainbow, we color-code according to intent such as awareness (blue), engagement (orange), and conversion (green, of course!).
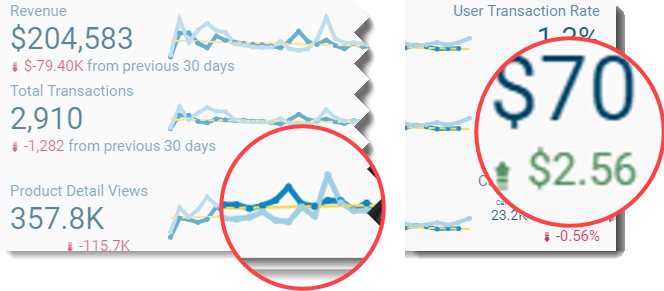
Easily view how your Key Performance Indicators (KPI’s) are trending
First, by default, we have selected the most actionable metrics to measure your awareness, engagement, conversion and loyalty goals. On the left will always be a volume or “quantity” metric where on the right it is compared to a “quality” metric. The balance of these two are key in order to maximize long term profits. Quickly find campaigns that may be performing well but are low in volume and immediately take action.
All trend reports are shown by week, comparing the last 24 weeks to the previous period (matched by weekday) or customized to your unique needs. This makes it easy to compare your current progress against last period as well as the last several weeks. We also include a trend line so you can keep heading up and to the right!
Transform raw Google Analytics data into meaningful opportunities.
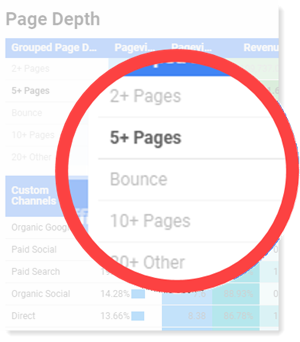
Much like grouping your traffic sources we take “Calculated Fields” as far as they can go. The data within Google Analytics may be “ugly” but the insights can get pretty amazing once transformed into workable groups. Think of how you could group together elements like Pages, Page Depth, Regions, and products!
Taking data transformation one step further we have also developed ways to clean up your URLs and Product Names. Get rid of pesky Query Parameters within your pages, unify uppercase and lowercase URLs, events or campaign names that appear separately in Google Analytics and so much more
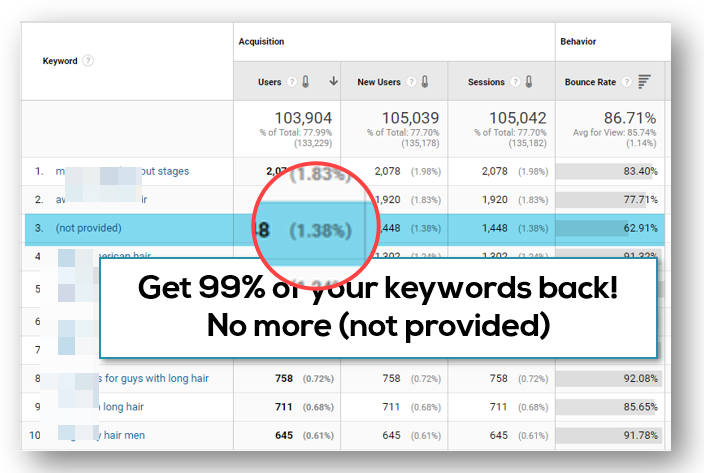
Get the organic keyword and SEO data you have needed in Google Analytics
Tired of 99% of your keywords being (not provided)?
Get your keywords, position and impression data back thanks to Keyword Hero’s algorithm. View important SEO page information like canonical URLs (or lack thereof), # words on a page, Google Lighthouse score and more with On-page Hero.
If you are interested in boosting your SEO rankings then you know your page has to contain the right blend of speed, content, alt descriptions, Correctly formatted Open Graph information, a high Lighthouse Score and so much more.
Be alerted when your metrics that matter suddenly change
Your metrics go up an down every day, it is the nature of the beast and no need to be alarmed. When the data is showing anomolies or outliers then you should probably know about it.
Create monitors for when your Facebook comments increase by 30% (woo hoo!) or if your Google Analytics sessions decrease by 20% over the same day last year. Is your sales staff converting less than adequate HubSpot leads or are they still stuck in cold lead land? Find out right away!

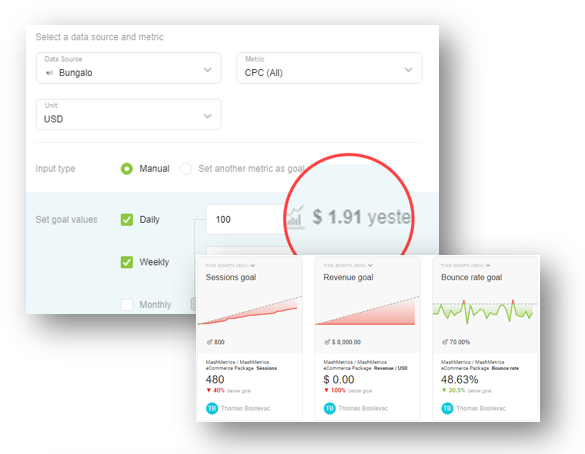
Performance monitors determine if you are on target to reach your goals … or not
While our Google Data Studio reporting templates deliver the metrics that matter, sometimes we need a quick snapshot of how data is tracking towards weekly, monthly, or quarterly targets and KPIs.
Make sure your Cost Per Click, Social Media engagement, Net New HubSpot leads and more are on track (or be warned before your boss finds out).