
Attribution: The difficult answer to where your marketing dollars are best spent. This has been a challenge for as long as marketers have been using more than one marketing method. Why does it continue to be so hot now? I believe it is because we expect there to be an easy software solution since this is digital analytics. There are hundreds of solutions promising to be the Top Marketing Attribution solution provider yet the data still seems out of reach, inaccurate, or inaccessible by the ones making the key decisions. While this sort of analysis is not and nor should be 100% accurate, our AI, Markov, Linear, or software approaches to attribution still rely upon accurate and actionable data.
In our experience, we see the basic information stored in your analytics broken in 3 areas, with one bonus challenge. Anyone of which decreases any additional efforts to tackle the attribution challenge, big budget or small. Luckily we have solutions somewhere in between:
- Clean Channel and Campaign data
- User Behavior
- Consistent User Identity
Clean Channel and Campaign Data
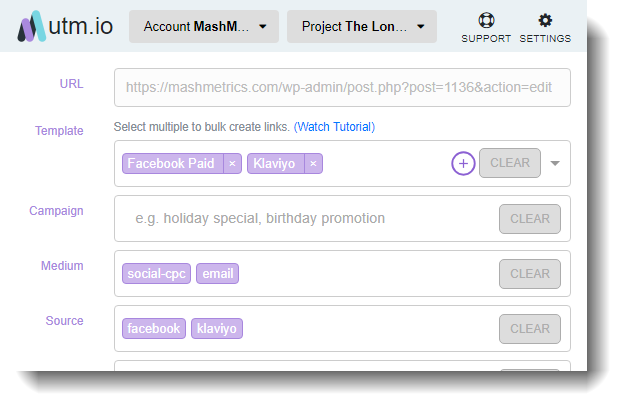
While the internet may be quite sophisticated, how we identify where traffic comes from is rather rudimentary. Amplitude, Segment and many other tools use Google Analytics UTM (urchin tracking mechanism) method that allows a multi-tier approach: Medium, Source, Campaign as well as more meta information like term and content. We are consistently surprised at how many times this first step is missed. While Google Ads to Google Analytics works perfectly when integrated together, same with Google Search Console (Our “Hero” integrations help solve the (not provided issue), Display Networks also make sure to send medium and source information. Where we see this break apart is with Social Media, Link Partners, and internal campaigns. This is technically easy to solve but can be an organizational hazard. Thanks to UTM.io for making this much easier!
Analytics Made Easy solution
In order to make sure that you collect the behavior of traffic coming from your 10% off coupon offer on Facebook using the red christmas background, you would append a link like such: https://www.yoursite.com/?utm_source=facebook&utm_medium=paid-social&utm_campaign=christmas&utm_content=redbg
In order to make sure that you collect the behavior of traffic coming from your 10% off coupon offer on your blog pages DO NOT use UTM’s. In almost all cases, use anything BUT UTM’s. This will wipe out any work you have done above in almost all of your reporting. (If you are well adept at using BigQuery, MCF’s, etc, then, they can be a viable option).
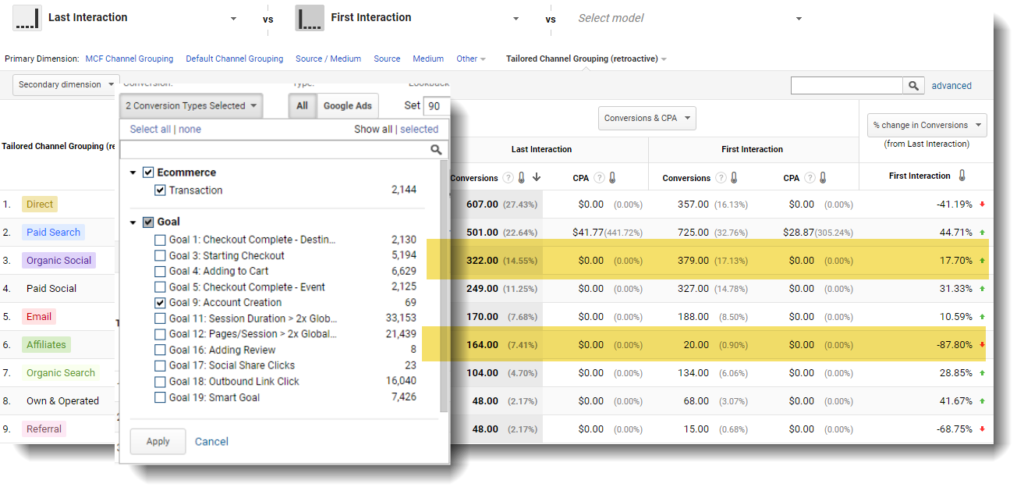
Consistent usage of these naming conventions allow you to report much deeper than the defaults. Customize Channel Groups to report on data as follows within Google Analytics and other tools.

We plan on writing much more on both Defining a UTM Strategy and Custom Channel Grouping in the future.
Sophisticated Marketer Answer
We all know we can do better. UTM.io really does help keep things clean and tidy and easy enough for the front desk person to add UTMs to outbound emails. But this isn’t your main challenge. Read on.
Measuring User Behavior beyond pageviews
Let’s assume now we know who and where humans are coming from on our website, mobile app, in-store, we must then track that user behavior. This is also easier said than done. Just place our javascript say all the analytics providers. Out of the box, however, tools collect generic pageview information, not the actionable information we need. The page being viewed and its URL and Title just don’t really cut it. From a conversion standpoint, often times we are simply collecting information on the ~4% of users that are actually making a purchase. What are the 96% doing? What leads them to that conversion. It isn’t just about channel attribution but also user engagement once they get to your properties.
Analytics Made Easy and Sophisticated Marketer Answer
From a device perspective, tools are getting better and better at this. You can drill down by OS, Browser, Device Type, Resolution, etc. from pretty much any tool. While responsive design and development needs rely heavily upon this information, marketers seem suffice with off the shelf information.
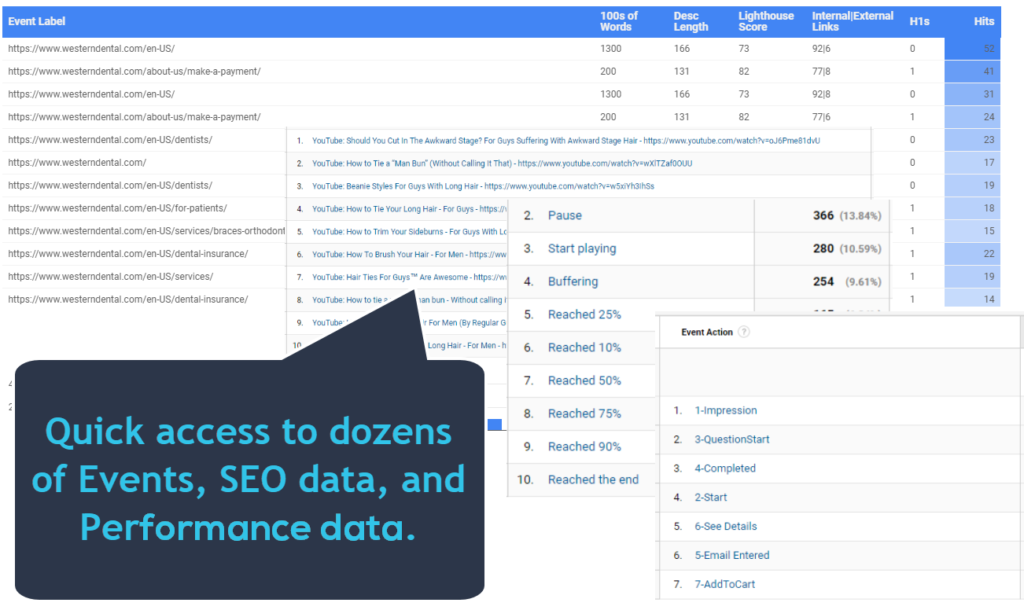
Our Analytics Made Easy packages go beyond device used and pages viewed. We collect WHAT your users are doing and viewing through our pre-configured Google Analytics Custom events (video performance, popup impressions and conversion, scroll rate, true time on page).
To give even more context and ability to quickly categorize this data we inject custom data (words on page, content category, page description, # of images, daypart, the users local browse time) allowing you to quickly collect more actionable data about your users. Not to mention create remarketing ads based upon this behavior!
Going a bit further, segments can be used in order to build robust user models based upon these various events and even scenarios taken by users e.g. watched a video then signed up for a newsletter then purchased. Or simply how many home listings they viewed.
Consistent User Identity
While some tools (Amplitude, Segment, MixPanel, KissMetrics) may do a better job identifying and reporting upon a “user” (our digital idea of a human) than the Google Analytics pixel the basic premise is the same. Keeping a consistent cookie or using a primary key to attach the behavior of two different devices together.
Of course, the sophisticated user identity is done by advertising platforms that have their pixel\cookie installed on their affiliated websites, apps, tools, etc. This is the reason why each provider requires the setup and installation of a javascript pixel (e.g. facebook pixel, adwords pixel, etc). The bigger the network, the better the collection of behavior. This makes marketers very happy to use Google Ads, Facebook Marketing, LinkedIn, because the data the big guys have collected is fantastic. This is not Multi-attribution though. GA is highly weighted towards its own network. Facebook only shows ad related information, and also is heavily weighted.
Analytics Made Easy Solution
The easiest method here is to utilize the built-in power of Google Analytics and their own cross-device tracking. While it is tough to rely upon the Last Click method used within the main Acquisitions > Channels report. The Conversion>Multi-Channel Funnel reporting can, in fact, be “good enough”. The key issue here remains proper source and medium information (above) and robust user behavior information (below)
At this point, you are reliant on proper channel naming and collecting enough user behavior information. Furthermore, we can help with reporting this information outside Google Analytics by using SuperMetrics, Data Studio, and Databox together.
Sophisticated Marketer Answer
Larger organizations try to bring this same technology in-house by using Customer Data Platforms (CDPs). For the somewhat budget conscience, Segment is a good start but will take quite a bit of time (100’s of hours) to get setup accurately with your marketing sources aligned and on and offline data integrations utilizing the same userid. They have a great resource on the subject here: https://segment.com/academy/collecting-data/an-introduction-to-multi-touch-attribution/. We have had the opportunity to use them, and it can certainly be worth it. There are other larger CDPs out there, but the price goes up and up.
Another means is to utilize Google Analytics amazing cookie pool along with your own customer data (CRM) integrating with your user registration system. When a user registers by email, or makes a purchase, or registers for an account for any reason, you can pass along a UserID (NOT their email, or name, but some alpha-numeric identifier) to both Google Analytics and 3rd Parties (Mailchimp, Marketo, Hubspot, SalesForce). This acts as your almighty Primary Key between these systems. While Segment helps when you have many of these systems to tie together on and offline, with some development across forms this can be done rather efficiently (20’s of hours) for a developer.

The Holy Grail – right in Google Analytics. The Multi-Channel Funnel and Model Comparison Tool.
Let’s say you are lucky enough to have gone this far.
You are collecting clean and accurate campaign information in the first place. You can easily tell the difference between a user coming from your blog post link sharing influencer from your general weekly social media posts. Let’s also assume that this information does not get shred off when users jump to your subdomain to make a purchase or jump from your blog.website.com to shop.website.com.
Let’s assume you can track a user across their path either by using Google Analytics out of box pixels, UserID tracking or even 3rd Party cookies from your CRM, A|B Tool, and more.
Let’s assume you are collecting more than just pageviews and purchases. Let’s assume you have setup segments, or better yet audiences based upon this information. Let’s assume you can slice and dice by words on the page as well as campaign name.
We can THEN use Google’s powerful Attribution Model Comparison Tool to generate powerful reports based upon First Interaction, Linear, Time Decay and other models. When the above techniques are used. This information is not actionable but highly accessible out of the box in Google Analytics. It does, however, take a bit of discovery and cannot be exported into Google Data Studio just yet. You can save your models, but, Multi-Channel Attribution is usually not something you can set and leave alone.
Talk to us today to discuss how our Analytics Made Easy packages or dedicated analysts can help along your journey.

What functionality do you put in your dashboards to make them more accessible? Please leave a comment here and follow us on Linkedin and Twitter!


1 Comment. Leave new
What a great article. It’s exciting to know in-depth analytics for specific requirements. I am enjoying learning from this.