While UnBounce and Google Analytics are different tools used for different purposes, many times the data (Pageviews, Conversions, Conversion Rate) between the two are compared. When done so this can confuse teams, create uncertainty in all data, and essentially cause lag in an essential use of analytics – testing and overall conversion rate optimization.
What is Unbounce?
UnBounce is a tool to create optimized landing pages, pop ups, banner variations and more with the intention of increasing conversions to your blog. UnBounce allows you to quickly test the best version of an A\B test, banner messages, and more. It does this through hosting different page variations, performing the calculations to evenly spread traffic, and measure the “winner”.
Google Analytics on the other hand is a data analysis platform with extremely high data processing capacity and allows you to extract customized reports for different needs. From the most basic analysis to the most complex reports, Google Marketing Platform offers the full suite of tools to analyze your website, SaaS service or mobile app. (including a competitive product, Optimize)
Why are similar metrics so different between the two tools?
Let’s explain the differences between the two systems and how we would (or would not) measure apples-apples. Although both Unbounce and Google Analytics provide relevant data about your landing pages, you need to understand that different tools can calculate metrics (with the same name) differently.
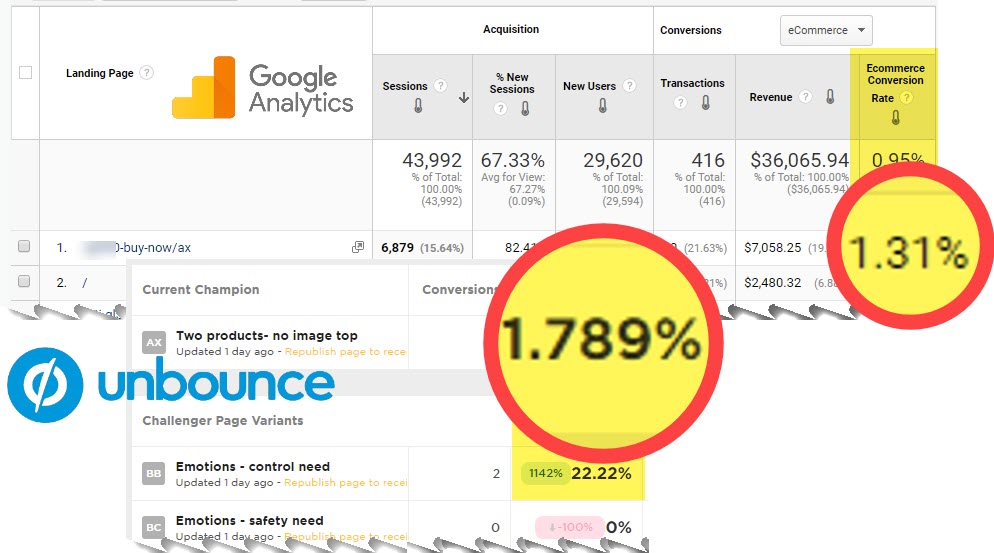
A good example of this is would be the Conversion Rate. Let’s take an eCommerce site for example, where the conversion has been setup to be a final transaction. You may see a different eCommerce conversion rate in the two tools, even for the same landing page and version.

- Google Analytics measures eCom conversion rate by: transactions (or any goal) / sessions
- Unbounce measures eCom conversion rate by: transaction (or any goal) / USERS
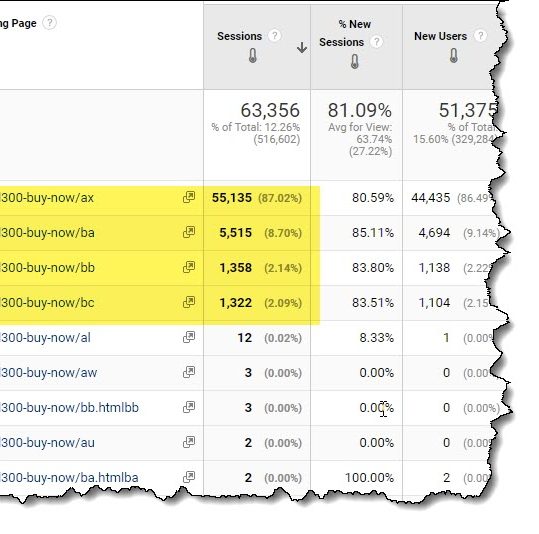
Another example is the good ‘ole reliable PageView (or simply View in UnBounce). While no metric in two different tools will remain the same forever (why do you think we “sync our watches” over time), there is another key difference in measuring page traffic stats between the two tools I have seen marketing teams and agencies alike get hung up on. Cardinality (or variations) of the page URL. When using the Google Analytics default integration with Unbounce, a unique request URI will be sent for each new version of a page. This can make overall measurement of pages confusing, especially when your boss wants a count of ALL pageviews.

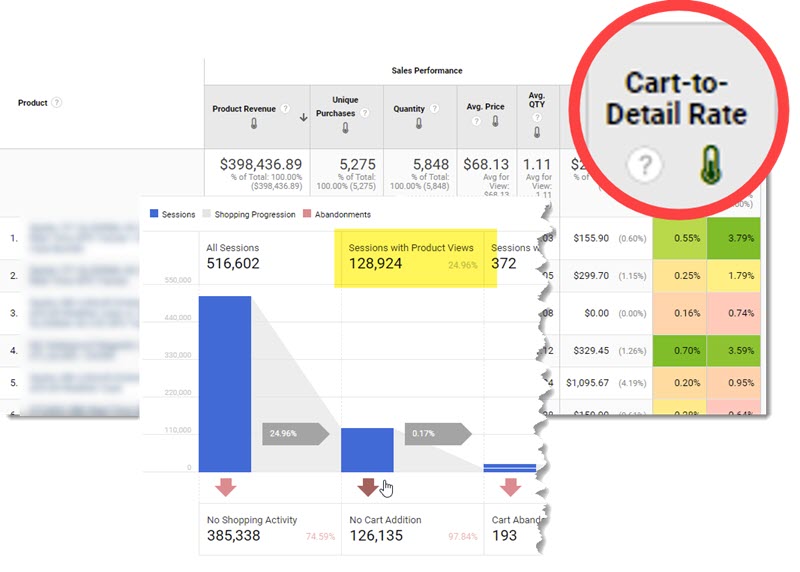
One metric that is in Google Analytics, but not in UnBounce is Product Detail View. So how do the two interact? When you are reviewing your Enhanced eCommerce reports, a key metric we use is Cart – to – Detail or Buy – to – Detail rates. This is measured through correct tagging of these events. Most of the time however, organizations are using UnBounce to serve a PDP but do not have these pages tagged with enhanced eCommerce. This can greatly effect your various flow reports and the metrics mentioned.

Last but not least, and really you should be taking this metric as a grain of salt in both tools, Visitors or as Google Analytics likes to say now, Users can also be different. Both have different cookie lengths, and so much more. Keep reading …
If the numbers are different, which one is correct?
If you buy 10 watches. Overtime each will slow down or speed up. Two years later you will be looking at 10 slightly different times, if even just by seconds or less. Which one is correct? Well at least for Father Time we have the Greenich Mean Time to sync against. We don’t have that accurate pillar for Marketing Analytics. There is no bouncer with a counter upon the entrance.
The solution: pick a “single source of truth” or a tool you always go to when reporting out success. Because in reality, there is no right or wrong.
Discrepancies between metrics certainly don’t just happen between Google Analytics and Unbounce. It is common to see different numbers for the same metric in different tools, especially over a longer period of time.
- tags take different times to load
- users open and close tabs at different intervals
- tag blockers work in different ways and block different tags
- one tag is at the top and the other at the bottom of the page – yes, users close windows before the page fully loads!
The important thing here is we are looking for trends and not swiss style precision in most cases. Marketing Analytics IS NOT exact accounting.
So which conversion rate should I use?
Like any metric, and any tool, use the one that makes the most contextual sense and leave it at that. In the case of GA vs UnBounce. Use the conversion rate within UnBounce as one marker of which landing page is working best. Use Google Analytics when reporting out to the team what your overall conversion rate is or how much traffic pages are going.
After reading this, do you still feel something is amiss. Schedule some time with us for a free review.