How to create a Date Filter for a select group of reports within Google Data Studio
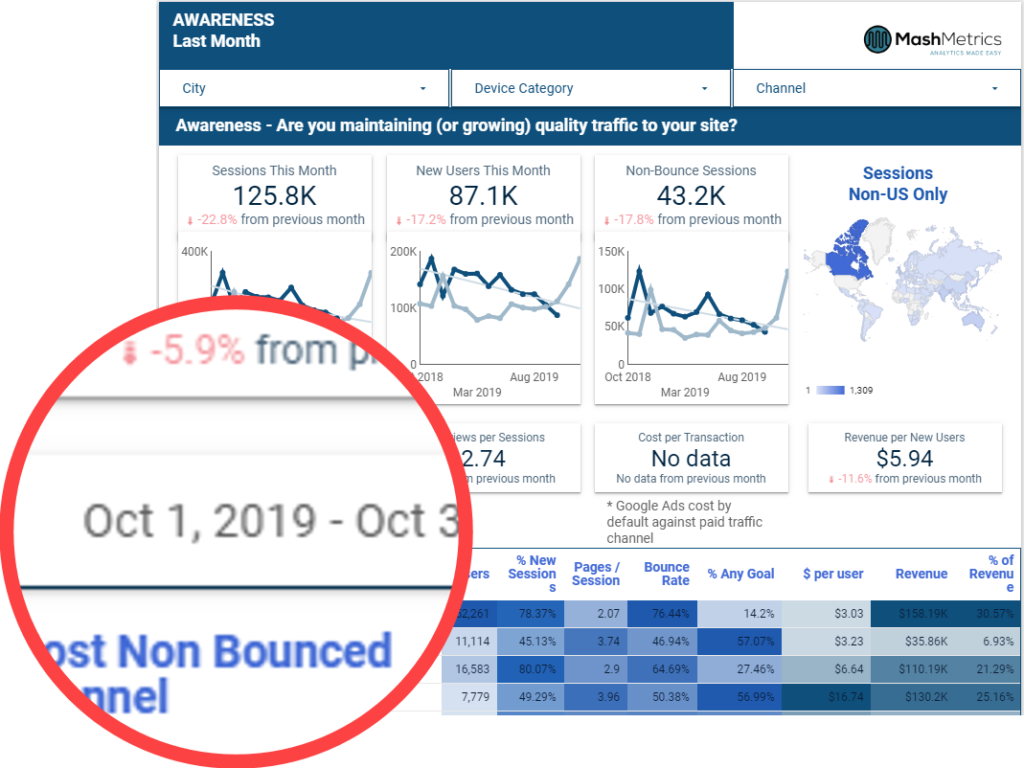
In many of our Google Data Studio templates, we have a set of key metrics at the top of the page, usually showing both a % change and longer-term trend. Below we show a few other more static table views. When first loaded, these follow the default data range. However, 97% of your clients or team members will ask for the data daily, weekly, last month, this month ….
How can I allow my users to get weekly, daily, monthly, any data range in my Data Studio report?
You will never make everyone happy all the time – so make your reporting more self-serve. Here is how to provide a nice Dashboard while also allowing users to slice and dice data.
Step 1 – Group desired Reports together
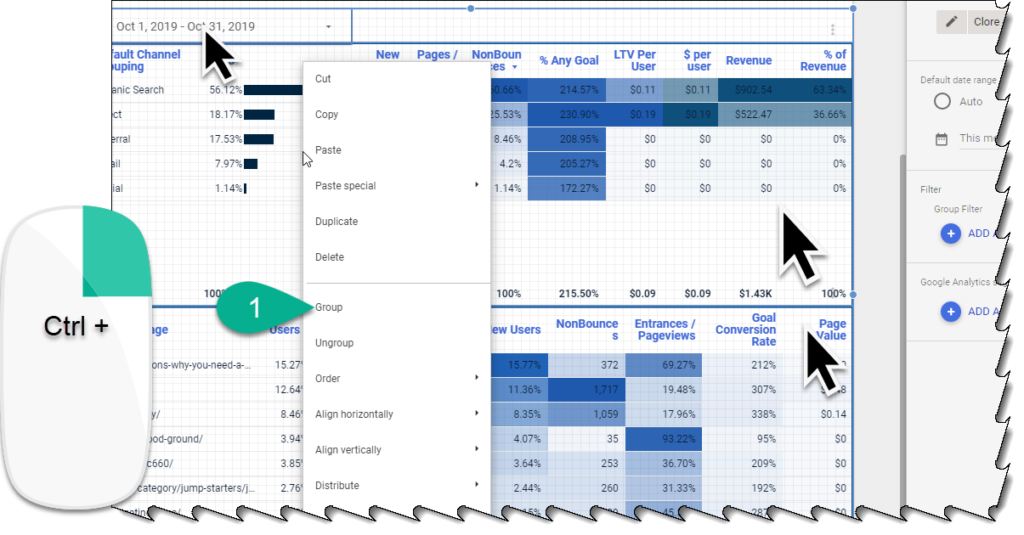
- Create Group by selecting more than one report (by holding down the CTRL button and clicking on reports), including the date range
- Right Click and select Group
Step 2 – Set Group Defaults
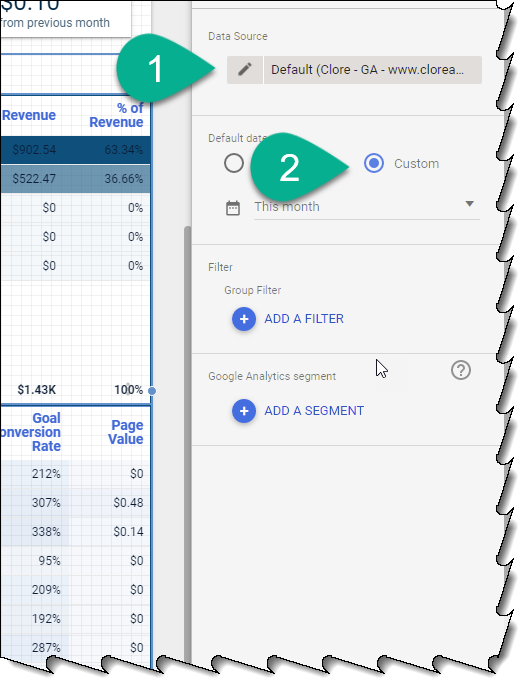
- Make sure a data source is selected
- Make sure a default date range is selected
Step 3 – Change all reports to AUTO date range
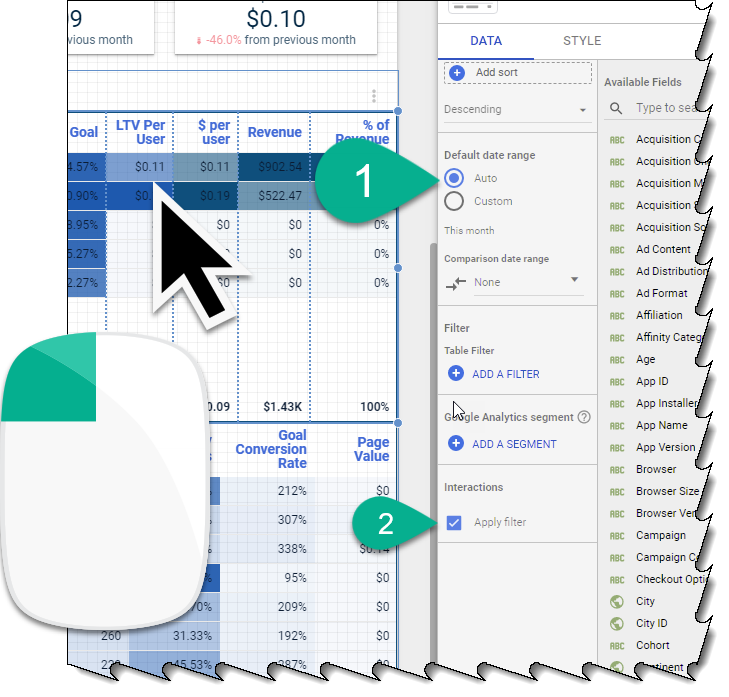
- Click on a single report
- Make sure the date range is on Auto
- OPTIONAL: The report can still be used as a filter for other reports
Step 4 – Go to View Mode to test out
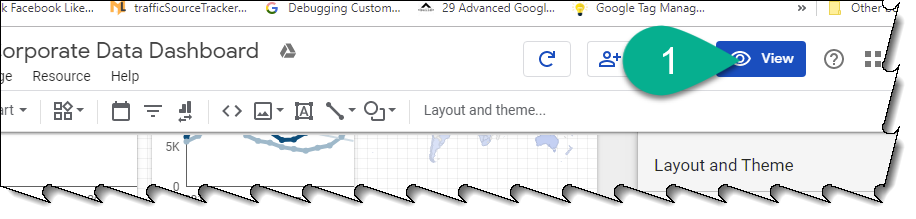
- Once complete, click on View on the upper right-hand side
Step 5 – Click Date Dropdown
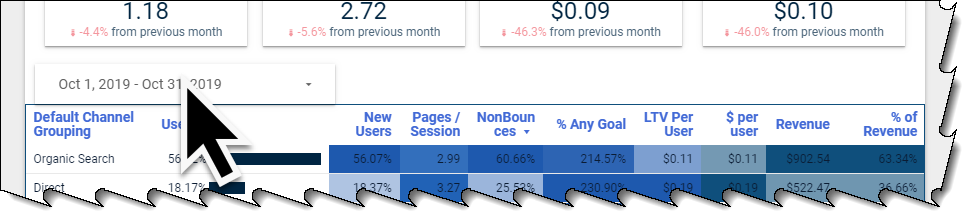
- Click on the date filter
Step 6 – Apply Date Range
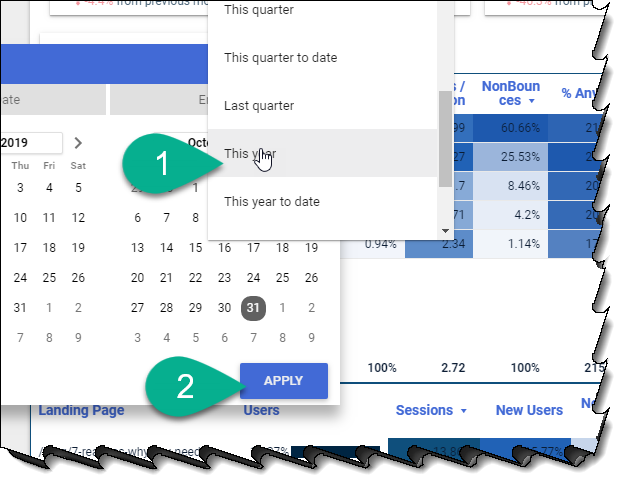
- Select from the list of ranges or use Custom
- Click Apply
View Data!
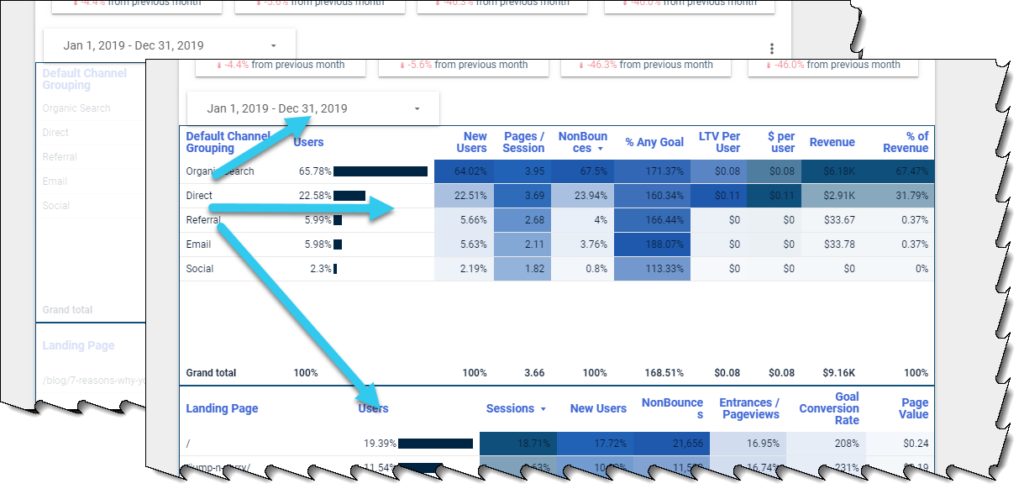
Select and View any date range you want!
What functionality do you put in your dashboards to make them more accessible? Please leave a comment here and follow us on Linkedin and Twitter!