You have just spent a lot of time creating a compelling content marketing strategy. Your content calendar is solid. The material looks great. You have promoted it to all the right channels. You are noticing a spike in traffic and things are looking positive from a quantity level. However, when you dig a little deeper you notice the Time Duration is 30 seconds with a 75% Bounce Rate. Not the kind of site engagement to brag to the boss about. Where did we go wrong?
- Content Marketing is supposed to engage my users
- My blog is supposed to drive people through my funnel
 Yes, content marketing is supposed to drive people through your funnel. You may likely have a few goals set up for your Contact Us form and Purchase, but if users purchased every time they read blog material we would all be living in glass houses.
This is a process that does not always involve a straight line. The reality is, your material likely IS being read. Your audience really DOES love you. Google Analytics is just not telling the whole truth. We will show you how to find the truth in this article.
This article will discuss:
- How Time on Site/Page and the Bounce Rate are measured
- Why this throws several content marketers off
- How to correct it. (And how NOT to)
How Time on Site/Page and the Bounce Rate are measured
Google Analytics first and foremost is extremely reliant upon Pageviews. This made complete sense “in the beginning”.
Everything happened as a result of a pageview.
Here in 2017 however, AJAX, jQuery, JavaScript, Bootstrap, (or the newest language developers at your nearest coffee shop are on) are used by developers to INCREASE user engagement. “Pages” are avoided like the plague. In many cases, you can submit a form, make a review, post on Facebook, and many other “activities” without ever leaving that page. (This is not even to mention websites and product launch pages that are ENTIRELY one page).
This is being done, because it works, and should not be changed just because Google Analytics makes things difficult. There are solutions.
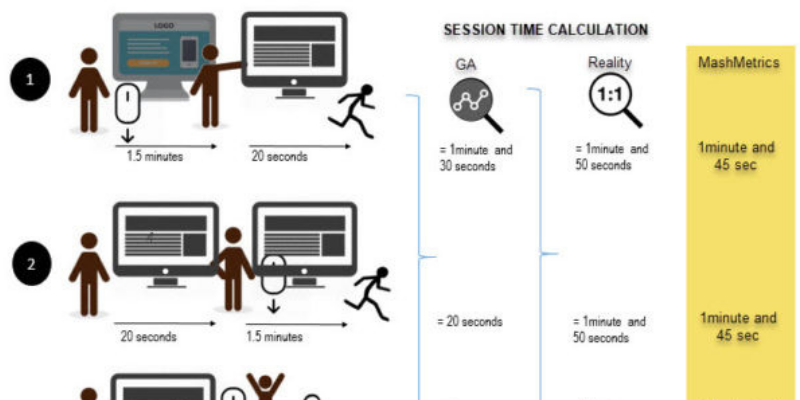
However, this causes a big problem with the way Google Analytics shows engagement. Looking at the various scenarios below, the data from GA on the left can be exponentially off compared to actual reality.
Can you find the pattern? Give Up? Google Analytics does not total the time spent on the LAST page! If there is no second page, it is as if the tree never even fell!
Let’s break a normal user interaction down:
- Let’s say for example sake the user comes in through your Paid Ad Campaign, spends time on the landing page, fills out the form, sees the confirmation and runs.
- Total time in reality? = 1 minute and 50 seconds
- GA = 1 minute and 30 seconds?
Not that far off … and who cares about the confirmation page?! We will get them next time.
Life seems great if this is what ALWAYS happened…
- The user comes back a few days later in response to our Product and Services drip email. They see the product page but really spend time on the services page afterward.
- Total time in reality? = 1 minute and 50seconds
- GA = 20 seconds
Whoa! That is not fair. The user actually was somewhat engaged in my services page. They found it fairly quickly. Give us some love Google!
- You spend days writing the perfect blog post. Screenshots, explainers, you name it. Your user gets the email promoting the content, clicks through, falls IN LOVE with it and reads from start to finish (just like you are doing now) and rushes off to share it with their friends using the share button that goes to another service.
- Total time in reality? = 13 minutes
- GA = 0 seconds
BOUNCE OK, now that is just WRONG. Sure they bounced, but that was certainly an engaged user. What is a marketer to do?! I can’t give these numbers to my boss!
Keep your job … Keep Reading!
How to accurately Measure for Site Engagement
The answer is rarely to throw up your arms and go directly to another tool. Until you start playing around with different page layouts or customized content there is no need for sophisticated HeatMaps (which while pretty, won’t give you a direct answer), Mouse Tracking software (sure, go through all the variations) or even worse screen recordings (zzzzz).
As you can imagine, Google Analytics is a LOT more powerful than it lends itself out of the box. The fact is you CAN measure this activity using Events. Events are not counted as “page-views” and can be used for many different purposes: knowing when users click a link on your site that is not in your domain (such as those links to social media sites), downloading the PDF file on your page, even watching videos.
For this post, we will concentrate on two events that will provide immediate value and takes care of the above issue almost entirely. And that is measuring users scroll activity as well as firing counters to measure how long users are on pages. Even if they bounce.
Scroll Tracking
By firing off an event within Google Analytics when a user scrolls through a certain percent of your page you can easily determine:
- How far are users really reading into my content?
- Do users stop at the comments section?
- Should I put a print button at the top or bottom?
- Where is the best placement of my lead magnet?
- Setup a Goal to measure overall campaign engagement.
Gotchas:
- Make sure you are using Non-Interaction events, especially if you are measuring in small percentages
- Each event counts as a “hit” within Google Analytics. You only get 10Million a month, so use accordingly. (1 complete pageview x every 10% = 10 hits…1M PVs)
- Some clients have measured by the amount of pixels down a page a user may scroll. On the surface, this sounds like a great idea. However users are provided almost unlimited variations in screen resolution, screen width/height, and even blocking software can determine what content is at what pixel height. If you want to do this, it must be segmented by screen height or even device type.
- If you have a “click to bottom” button, pay attention to the percentages. We recommend tracking the # of times the button is used to compare against
Time On Page
I think by now we have determined that the way Google is measuring how long users are spending on your website is just plain wrong. We suggest using counters on the page to track at incremental levels. Our recommendation is every 15 seconds of actual focus on the page.
- How long are users spending on my pages, even if they bounce?
- What is the breaking point of my content, where do I lose critical mass?
- What percent of users are jumping right away (15% … a TRUE bounce)?
- What percent of users are spending at least 45seconds on a page (Adjusted Bounce Rate)
Gotchas:
- Make sure you are using Non-Interaction events, especially for anything less than 45 seconds
- Each event counts as a “hit” within Google Analytics. You only get 10Million a month, so use accordingly. (2 minutes x every 10sec = 12 hits = limit 834K PVs)
- This 10MM limit is for ALL hits combined
With the advent of Plug-ins and Google Tag Manager, there are many off-the-shelf DIY solutions out there.
Things to watch out for:
- Some programs fire events after just a few seconds on a page, artificially deflating your Bounce Rate to under 10% (although it would look good to your boss).
- While you may have GA already installed on your website, other plug-ins may duplicate the tag, again deflating your Bounce Rate
- Inconsistent naming conventions make reporting difficult
Here is the output of these events within Google Data Studio:
What functionality do you put in your dashboards to make them more accessible? Please leave a comment here and follow us on Linkedin and Twitter!
2 Comments. Leave new
[…] generation or traffic engagement is the reason why you have a website right? No matter how confident you are about your goods and […]
[…] Spotty User This example WOULD affect the Session Count. We send an “interaction hit” to GA when the user hits 45 seconds, this is how we gain the “Adjusted Bounce Rate“. […]